
What gets measured gets managed. As organizations push to move past AI tool adoption and toward true AI native SDLC processes, organizations need a proper productivity measurement system. Here we present that definitive framework. Four core metric “domains” plus our north star aggregate metric to support executive steering.
An engineering leader sits in front of their board, trying to justify a massive token bill and investments in a harness or new tooling. They point to a chart showing a huge spike in pull requests, but the board’s not impressed. Despite the flurry of new code, the actual rate of software shipping to customers hasn’t really changed. They don’t feel it, and they don’t see it.
How we measure software engineering productivity has always been a bit of a debate. That debate has even included celebrated arguments that measurement itself is a flawed premise. In a way, we at 3Pillar agree with the flawed premise argument – at least in the sense that business impact should be top of mind when tracking engineer performance overall.
That’s a Product Mindset applied to performance monitoring, so of course it resonates.
But when pursuing a complete engineering transformation (this time with AI), the question of hard measurable data is pretty important. The investment doesn’t just need justification, it needs guidance through real, hard data that can inform steps taken. That can’t be hand-waved to business impact alone, and it’s not just code volume either.
AI lets engineers create code much faster, for sure. But as the industry has come to realize, without the right guardrails, it lets them create defects and eventual technical debt just as quickly.
To make matters worse, leaders often try to force these new tools onto their teams using top-down mandates. They focus entirely on ROI and ignore how developers actually feel, which will harm that ROI inevitably.
“If you go about AI adoption with a heavy hand, you might find worse than a lackluster impact. Bringing AI to the SDLC is a transformative change when done correctly. It’s not just a toolset change so it needs to be treated as organizational transformation. And like any real cultural shift like this, leaders must consider how people will react and be empathetic if they’re hoping for real outcomes.”
— 3Pillar Transformation Lead
To govern this kind of transformation successfully, you have to stop counting raw outputs and start measuring process effectiveness, which is more than any one volume counter.
Basically, you need to look at the engineering org like a vertically integrated factory floor where raw ideas go in the front door, and valuable, shipped product features come out the back. The new goal is measuring how cleanly new ideas move all the way to production without setback.
We built the AI SDLC performance measurement framework below, to do exactly that.
Tested and proven within 3Pillar’s own AIRE framework for responsible AI native engineering as well as across our active client SDLC transformation programs, this model aligns everyone from individual developers up to the C-suite.
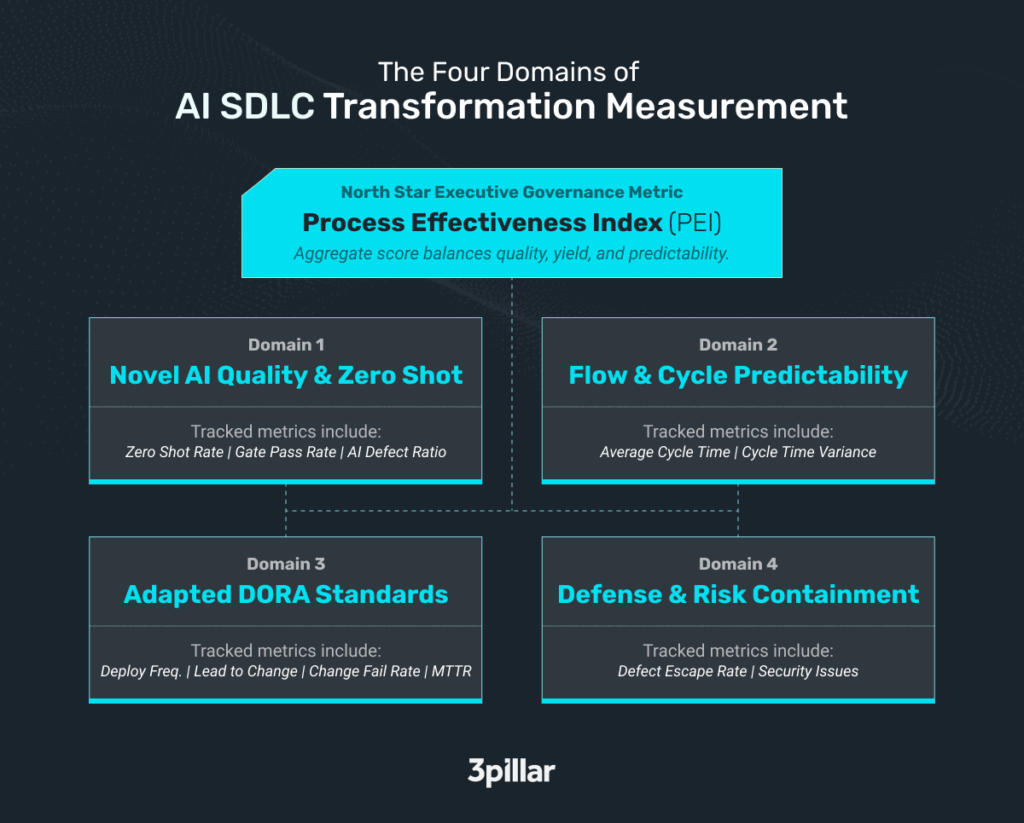
Here is the metric framework we use to make real AI adoption visible, measurable, and predictable.
A quick note on gates
To make this framework work, you have to establish hard delivery gates. A gate is simply a mandatory checkpoint in your workflow where a piece of work (or some subset of pieces of work, sampling production outputs) must be reviewed and approved before it can move to the next stage. This could be a design approval, an automated code review, or final QA acceptance. Especially in the early stages of adoption, these checkpoints are often mandatory human review and approval.
In the following five sections, we will break down these metric domains, indicating exactly what they measure across gates and why they’re so important for an AI transformation.
We will start with the four primary domains that track daily engineering realities, and then end on the top-line Process Effectiveness Index (PEI) which brings it all together for the boardroom.
Domain 1: Novel AI Quality & First-Pass Yield
One of the biggest, emerging fears with AI code generation is producing garbage at scale.
If an agent writes some feature in five seconds but a human spends three hours fixing it, your productivity has actually gotten worse. This first domain focuses on the purity of AI agent outputs across the entire lifecycle, starting from early planning and ending at QA.
It answers a critical question. Is the AI getting it right on the very first try?
Domain 2: Flow Speed & Cycle Predictability
While cost-cutting tends to be the focus of journalists and market voices when talking about corporate AI adoption, speed is the primary reason organizations invest in agentic engineering.
But speed without consistency makes it impossible to commit to meaningful business deadlines. Metrics Domain #2 isolates pure, active engineering performance. It deliberately excludes upstream product planning and downstream release delays to show exactly how fast the team is actually building. It tells you if your AI adoption is creating reliable velocity lift or just sporadic bursts of output.
Domain 3: Adapted DORA Delivery Standards
DORA metrics have been the industry gold standard for years, and for good reason.
But for our AI SDLC performance measurement framework, we sought to adapt classic DORA benchmarks to fit AI assisted execution and release schedules.
If your organization uses a batched release cadence, standard DORA metrics will penalize engineering for delays in the release queue. The reason is that in these environments, production deployment boundaries often stop at release readiness rather than automated production releases. We adapted these classics to show how fast AI drives finished value to the doorstep of production.
Domain 4: Defense & Risk Containment
When engineering throughput doubles, the stress on your QA and security gates might quadruple. Similar to HBR’s Workslop problem, and as the engineering world is finding more and more, code velocity alone only makes life harder on downstream roles.
This fourth domain measures that your risk controls are actually working. It provides the hard proof your security and compliance teams need to trust the transformation, ensuring that AI is not quietly scaling your vulnerabilities.
The Executive Summary Layer: The Process Effectiveness Index (PEI)
When engineers present their progress to leadership, they cannot drop a dozen technical charts on the table. Executives just don’t have the time to mentally weigh a rising pull request count against a dipping defect rate. And frankly, getting all of the data without synthesis makes blocking and tackling harder. Leaders need a single, defensible number that proves whether the AI investment is actually working.
To solve this, we created the Process Effectiveness Index (PEI).
Think of PEI as the north star for the entire engineering organization. It is a single composite score, baselined at 100, that rolls up four critical metrics into one clear trendline. We’ve carefully defined our own calculation for real world value.
Why build a composite score? Because any targeted metric can be manipulated and gamed through its weakest input, and also because sometimes the numbers just tell the wrong story when seen in a vacuum. The PEI forces a true balance across the most important operational realities, for better governance.
- PEI demands quality: If speed lifts but a team’s AI defect ratio spikes as a result, their PEI score will stay flat or drop.
- PEI demands first-pass yield: If bad code is consistently getting pushed to QA, the failing gate-pass rate will drag the index down.
- PEI demands predictability: Erratic delivery cycles will ruin the variance score, even if the average speed looks acceptable.
A composite is only as credible as its weakest metric. This index requires strict discipline in tracking defects and gate events. It completely eliminates anecdotal productivity claims and gives leadership a single number they can trust.
How We Implement the Control Tower
To make this operational, we implement a flexible, open source technology stack. But there are many ways to do this.
At the core, 3Pillar utilizes Apache DevLake to automatically extract structured data from existing tools like GitHub, Jira, and SonarQube. This data feeds into a centralized data lake. We then layer Grafana over the top for dynamic visualization.
Another important detail, we’ve built custom dashboards across four hierarchical tiers:
We track data at the pod level, the product level, the product line level, and the executive level. Everyone in the organization uses the exact same platform. A pod developer can log in and see their exact bottlenecks using the same underlying data the CTO uses to present to the board.
Where we’re heading: Expectations for the next phase of AI SDLC measurement
The core metric domains above give leadership a clear look at where things stand during the AI SDLC transformation journey when asking “how do we know if AI SDLC change is really working?”
As teams mature in their AI usage, new blind spots will absolutely and naturally appear. We expect this, and are currently exploring a second phase of metrics to close these gaps and capture the human costs of agentic work.
“If you’re going to measure developers, they really require access to the exact same dashboards. They should be able to manage their own performance and answer meaningfully in the same language as leadership, rather than just being asked ‘what’s going on’ if they aren’t hitting a target”
Here are the specific areas we are looking at next:
- Developer Experience Pulse: A traditional organization adopting agentic development fails on its people before it fails on its tooling. A short, regular pulse survey tracks developer confidence and friction at quality gates to provide an early warning system for retention risk.
- Abandonment Rate: AI adoption tends to shift failure from traditional rework to simply throwing away bad code and regenerating it. Tracking the share of started work units abandoned before QA acceptance makes this hidden waste visible.
- Deployment-Ready Queue Age: As AI raises engineering throughput, finished work will stack up waiting for release. Measuring the count and age of work sitting in the deployment queue puts a clear price tag on release cadence constraints.
- Intent-to-Plan Lead Time: AI promises faster planning through automated elaboration. This metric measures the elapsed time from when an idea is created to when its AI generated work plan is officially approved.
Bottom Line
It’s clear now that moving an engineering organization to run on agentic workflows takes much, much more than buying new tools. It requires a massive cultural and operational shift and if you try to measure that shift with old vanity metrics, you will fly completely blind.
Teams need a system that tracks actual quality, pure engineering speed, and true first-pass yield. We believe that the model we’ve laid out provides that exact system for this – at least a foundation. It continues to evolve.
By giving engineering pods the data they need to improve their own workflows while giving the governance group the hard proof required to justify the investment, change happens more predictably and smartly. Measuring AI native engineering is certainly complex, but it does not have to be a guessing game.